Use Google Analytics to Grow Your Business
Unlocking the secrets to business growth often hinges on understanding your online audience. Google Analytics provides a powerful toolkit to analyze website traffic, identify high-performing content, and optimize marketing strategies. By leveraging its data-driven insights, businesses can make informed decisions, improve conversion rates, and ultimately achieve sustainable growth.
This guide explores how to effectively utilize Google Analytics' features, from tracking website visits and user behavior to segmenting your audience and tailoring marketing campaigns for maximum impact. We'll delve into key metrics, practical strategies, and actionable steps to transform raw data into valuable business intelligence.
Understanding Your Website Traffic with Google Analytics
Google Analytics (GA) is a powerful free tool that provides invaluable insights into your website's performance. Understanding how your website visitors behave is crucial for optimizing your online presence and ultimately, growing your business. By leveraging the data GA provides, you can make data-driven decisions to improve your marketing strategies, website design, and overall user experience.
Website Tracking and User Behavior in Google Analytics
Google Analytics tracks website visits using JavaScript code embedded on your website. This code monitors various aspects of user interaction, including page views, time spent on each page, the path users take through your site (their journey), and the actions they take (such as making a purchase or filling out a form). GA uses cookies and other technologies to identify unique users and track their behavior across multiple sessions.
This detailed information allows businesses to understand the effectiveness of their website and marketing efforts. For instance, GA can track which marketing campaign led to a specific conversion, enabling precise ROI measurement.
Key Metrics for Business Growth
Several key metrics within Google Analytics are particularly relevant for business growth. These metrics offer a comprehensive view of your website's performance and user engagement.
| Metric | Description | Importance for Business Growth | Example |
|---|---|---|---|
| Bounce Rate | Percentage of visitors who leave your website after viewing only one page. | High bounce rate suggests issues with website content, design, or user experience. | A bounce rate of 70% indicates that 7 out of 10 visitors are leaving after viewing only one page. |
| Conversion Rate | Percentage of visitors who complete a desired action (e.g., purchase, signup). | Directly reflects the effectiveness of your website in achieving business goals. | A conversion rate of 2% means that 2 out of 100 visitors made a purchase. |
| Average Session Duration | Average time visitors spend on your website during a single session. | Indicates user engagement and interest in your website's content. | An average session duration of 5 minutes suggests good user engagement. |
Segmenting Website Traffic
Segmenting your website traffic allows for a more granular understanding of your audience. By analyzing different segments, you can tailor your marketing efforts and website content to specific user groups.GA allows you to segment traffic based on various criteria, including demographics (age, gender), location (country, city), and acquisition source (organic search, paid advertising, social media). For example, you might discover that users from a specific geographic region have a higher conversion rate, allowing you to focus your marketing efforts on that area.
Similarly, identifying the most effective acquisition channels helps you allocate your marketing budget more efficiently.
Google Analytics Reports and Their Usefulness
Understanding the various reports available in Google Analytics is crucial for making informed business decisions. Different reports provide insights into different aspects of website performance.
| Report | Description | Usefulness | Example Decision |
|---|---|---|---|
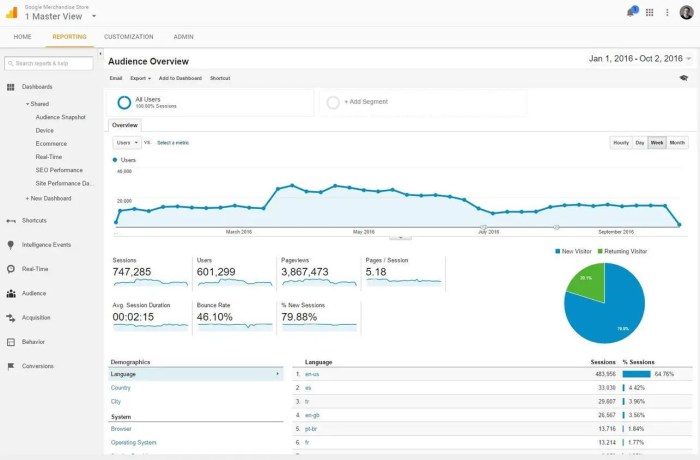
| Audience Overview | Provides a summary of your website's users. | Understanding your audience demographics and behavior. | Targeting specific demographics with tailored marketing campaigns. |
| Acquisition | Shows how users arrive at your website. | Optimizing marketing channels and budget allocation. | Increasing investment in high-performing channels like social media. |
| Behavior | Tracks user behavior on your website. | Improving website navigation, content, and user experience. | Redesigning a confusing section of the website based on high bounce rates. |
| Conversions | Measures the success of your marketing and website goals. | Assessing the effectiveness of marketing campaigns and website optimization efforts. | A/B testing different call-to-action buttons to improve conversion rates. |
Identifying High-Performing Content and Channels
Understanding which content resonates most with your audience and which marketing channels are driving the most valuable traffic is crucial for optimizing your online presence and achieving business growth. Google Analytics provides the tools to uncover these insights, enabling data-driven decisions that improve your ROI. By analyzing your website's performance, you can refine your content strategy and allocate resources effectively.
Google Analytics offers a wealth of data to pinpoint high-performing content and channels. By leveraging its reporting features, businesses can gain a clear understanding of user behavior and the effectiveness of their marketing efforts. This information is vital for making strategic improvements and maximizing the return on investment for both content creation and marketing campaigns.
Identifying Top-Performing Website Pages
To identify your website's most popular pages, navigate to the Behavior > Site Content > All Pages report in Google Analytics. This report displays a list of all pages on your website, ranked by pageviews, unique pageviews, average session duration, and bounce rate. Focusing on pages with high pageviews and low bounce rates indicates content that keeps users engaged.
You can also examine the average session duration to understand how long users spend on specific pages, suggesting content depth and user interest. By analyzing these metrics, you can identify content that resonates strongly with your audience and serves as a foundation for further content development.
Analyzing Marketing Channel Performance
Determining which marketing channels deliver the most valuable traffic involves examining the Acquisition > All Traffic > Source/Medium report in Google Analytics. This report breaks down your traffic sources, such as organic search, social media, email marketing, and paid advertising. Each source is categorized by medium (e.g., organic, cpc, referral). By comparing metrics like users, sessions, conversions, and conversion rates across different channels, you can identify which channels are driving the most valuable traffic – meaning traffic that leads to desired actions, such as purchases or sign-ups.
For example, a high conversion rate from a specific social media campaign indicates its effectiveness in generating qualified leads.
Optimizing Content Based on Analytics Data
Once you've identified high-performing content and channels, you can use this information to refine your strategy. For example, if a blog post on "X topic" consistently receives high engagement, you can create similar content focusing on related s or expand upon the original post with more in-depth information. If a particular marketing channel, such as email marketing, shows a high conversion rate, you should increase your investment in that channel.
Conversely, if a channel underperforms consistently, you may need to adjust your strategy or reallocate resources to more effective channels. This iterative process of analysis and optimization is key to maximizing the impact of your content and marketing efforts.
Workflow for Regular Google Analytics Analysis
A consistent workflow ensures you regularly leverage the power of Google Analytics. A suggested schedule is a weekly review of key metrics, followed by a monthly deep dive into specific reports. The weekly review focuses on immediate trends, such as sudden drops in traffic or spikes in conversions from a specific campaign. The monthly analysis provides a broader perspective, allowing you to identify long-term patterns and make strategic adjustments to your content and marketing strategy.
This structured approach enables timely responses to changing trends and proactive optimization of your online presence. Documenting findings and action plans ensures accountability and allows for tracking the effectiveness of implemented changes.
Improving Website Conversion Rates
Optimizing your website for conversions is crucial for business growth. Understanding where visitors drop off and what actions they take is key to improving your bottom line. Google Analytics provides the tools to identify these areas and implement effective strategies for improvement. By analyzing user behavior and testing different approaches, you can significantly boost your conversion rates.
Identifying Conversion Bottlenecks
Pinpointing the specific areas on your website that are hindering conversions requires a systematic approach. This involves examining various aspects of the user journey, from initial landing page experience to the final conversion action. Google Analytics offers several reports to help identify these bottlenecks. For example, analyzing bounce rates on specific landing pages can highlight pages with poor engagement or confusing content.
Similarly, analyzing the behavior flow report can illustrate how users navigate your site and where they abandon the process. By identifying these points of friction, you can begin to address the underlying issues.
Tracking Conversion Events and Measuring Effectiveness
Google Analytics allows you to track specific actions that constitute a conversion, such as form submissions, purchases, or newsletter sign-ups. Setting up conversion tracking involves defining specific events and assigning values to them. For instance, a successful purchase might be assigned a monetary value, while a newsletter signup might be assigned a lead value. Once set up, Google Analytics provides detailed reports on the number of conversions, conversion rates, and other key metrics.
This data allows you to measure the effectiveness of your website optimizations and understand the return on investment of your efforts. For example, tracking the conversion rate before and after implementing a new call-to-action button can reveal its impact on conversions.
A/B Testing for Conversion Rate Optimization
A/B testing is a powerful technique to compare different versions of website elements and determine which performs better in terms of conversions. This could involve testing different headlines, call-to-action buttons, or page layouts. Google Optimize, integrated with Google Analytics, facilitates A/B testing by allowing you to create variations of your web pages and track their performance against the original.
By analyzing the results, you can identify the version that drives the highest conversion rate and implement it across your website. For example, testing two different versions of a landing page, one with a prominent call-to-action button and another with a less prominent one, can reveal which design is more effective at driving conversions.
Actionable Steps to Improve User Experience
Based on Google Analytics insights, several actionable steps can be taken to improve website user experience and subsequently boost conversion rates.
- Optimize Page Load Speed: Slow loading pages lead to high bounce rates. Google Analytics can identify slow-loading pages, allowing for optimization efforts like image compression and code minification.
- Improve Website Navigation: Confusing navigation frustrates users. Analyze user behavior flows in Google Analytics to identify areas where users struggle to find information and simplify navigation accordingly.
- Enhance Mobile Friendliness: A significant portion of website traffic comes from mobile devices. Google Analytics provides mobile usage data, enabling identification of areas needing mobile optimization.
- Personalize User Experience: Tailoring content to individual user preferences can improve engagement and conversions. Google Analytics can help segment users based on behavior and demographics, enabling personalized content delivery.
- Optimize Forms: Complicated forms deter users from completing actions. Analyze form abandonment rates in Google Analytics to identify areas for simplification and improvement.
Tracking and Analyzing Marketing Campaign Performance
Understanding how your marketing efforts translate into tangible business results is crucial for growth. Google Analytics provides the tools to meticulously track and analyze the performance of your marketing campaigns, offering valuable insights to optimize spending and maximize return on investment (ROI). By connecting your marketing channels to Google Analytics, you gain a comprehensive view of your campaign's effectiveness, allowing for data-driven decision-making.Google Analytics offers several methods for tracking marketing campaign performance.
This involves tagging your marketing materials with unique UTM parameters, allowing you to differentiate traffic sources and measure the success of individual campaigns within the platform. This granular data enables a precise understanding of which channels are driving the most valuable conversions.
Setting Up Google Analytics for Campaign Tracking
To effectively track marketing campaigns, you must use UTM parameters in your marketing links. These parameters append extra data to URLs, allowing Google Analytics to identify the source, medium, campaign, and content of each visitor. For example, a link to a blog post promoted on Facebook could look like this: `https://www.example.com/blog-post?utm_source=facebook&utm_medium=social&utm_campaign=spring_sale&utm_content=blog_post_link`. Each parameter provides specific information to Google Analytics.
`utm_source` identifies the origin (e.g., facebook), `utm_medium` specifies the channel (e.g., social), `utm_campaign` names the specific campaign (e.g., spring_sale), and `utm_content` differentiates various links within the same campaign (e.g., blog_post_link). By consistently using UTM parameters, you can accurately attribute conversions to their respective marketing channels. Google Analytics then provides reports detailing the performance of each campaign.
Comparing Marketing Channel Performance
Once data is collected, Google Analytics' Acquisition reports provide a detailed breakdown of traffic sources and their contributions to conversions. The "All Traffic" > "Source/Medium" report is particularly useful for comparing the performance of different marketing channels. This report shows the number of users, sessions, conversions, and other key metrics for each source and medium, enabling direct comparison of, for instance, Facebook ads versus email marketing.
A business might discover that email marketing consistently delivers a higher conversion rate than paid search, suggesting a need to reallocate resources accordingly. Visualizations within the report, such as graphs and charts, further simplify the comparison process.
Identifying Areas for Improvement
Analyzing the data revealed in Google Analytics reports helps pinpoint areas for improvement. Low conversion rates from a specific channel, for instance, could indicate a need for improved ad copy, targeting, or landing page optimization. A high bounce rate from a particular campaign might suggest the content isn't relevant to the target audience. Google Analytics' Behavior reports, which provide insights into user engagement on your website, can offer additional context.
For example, a low average session duration could signal a lack of engaging content or a poor website user experience. By identifying these weaknesses, you can refine your marketing strategies for better results.
Marketing Spend and Return on Investment (ROI) Visualization
Imagine a simple table representing the relationship between marketing spend and ROI.
| Marketing Channel | Marketing Spend ($) | Conversions | Revenue ($) | ROI (%) |
|---|---|---|---|---|
| Facebook Ads | 1000 | 50 | 5000 | 400% |
| Email Marketing | 500 | 30 | 3500 | 600% |
| Google Ads | 1500 | 60 | 4000 | 166.67% |
This illustrates a scenario where email marketing, despite having a lower marketing spend, generates a higher ROI than Facebook Ads or Google Ads. This type of analysis, facilitated by Google Analytics data, allows for data-driven optimization of marketing budget allocation. A higher ROI for email marketing might lead to increased investment in this channel while potentially reducing investment in underperforming channels.
The key is to continuously monitor and adjust based on the data provided by Google Analytics.
Using Google Analytics for Customer Segmentation and Targeting
Understanding your customer base is crucial for effective marketing. Google Analytics provides the tools to segment your audience based on various behavioral and demographic data, allowing for highly targeted campaigns and personalized website experiences. This leads to improved conversion rates and a stronger return on investment (ROI).
Google Analytics allows you to segment your customers based on a multitude of factors. This includes demographics like age and location, behavioral data such as website engagement (pages visited, time spent on site), acquisition channels (organic search, paid advertising), and even specific actions taken on your website (e.g., adding items to a cart, completing a purchase). By combining these data points, you can create highly refined customer segments with unique characteristics and needs.
Creating Targeted Marketing Campaigns Based on Customer Segments
Once you've segmented your audience, you can tailor your marketing messages and offers to resonate with each group. For instance, a segment of users who frequently abandon their shopping carts might receive a targeted email campaign offering free shipping or a discount to encourage completion of their purchase. Conversely, a segment demonstrating high engagement with specific product categories might receive personalized recommendations or exclusive early access to new products within those categories.
The key is to create messaging that is relevant and valuable to each segment, increasing the likelihood of engagement and conversion.
Personalizing Website Content for Different Customer Segments
Personalization extends beyond email marketing. Google Analytics data can inform website content customization. For example, a website selling clothing might display different product recommendations based on a user's past browsing history or demographic information. A user frequently viewing athletic wear might see prominently featured running shoes and sportswear, while a user browsing formal attire would see suits and dresses highlighted.
This level of personalization enhances the user experience and makes the website more relevant to individual needs, fostering stronger engagement and loyalty.
Implementing Retargeting Campaigns Based on Google Analytics Data
Retargeting campaigns focus on re-engaging users who have previously interacted with your website but haven't completed a desired action (e.g., making a purchase). Google Analytics provides the data needed to identify these users and tailor retargeting ads accordingly.
A step-by-step guide to implementing retargeting campaigns using Google Analytics data:
- Identify your target audience: Use Google Analytics to define segments of users who have shown interest in your products or services but haven't converted. This might include users who added items to their cart but didn't complete the purchase, or users who viewed specific product pages but didn't click through to the checkout.
- Create custom audiences: Within Google Analytics, create custom audiences based on the identified segments. This involves defining the specific criteria that define your target audience (e.g., users who visited the "products" page but didn't visit the "checkout" page).
- Link Google Analytics to your advertising platform: Connect your Google Analytics account to your chosen advertising platform (e.g., Google Ads). This allows you to seamlessly transfer your custom audiences from Google Analytics to your advertising platform.
- Create retargeting ads: Design targeted ads specifically for each custom audience. These ads should resonate with the audience's past behavior and address any pain points that might have prevented them from converting initially. For example, for users who abandoned their shopping carts, the ad could highlight free shipping or a discount.
- Monitor and optimize: Track the performance of your retargeting campaigns using Google Analytics and your advertising platform. Analyze key metrics such as click-through rates (CTR), conversion rates, and return on ad spend (ROAS) to optimize your campaigns for better results. Regularly review and refine your audience segments and ad creative based on performance data.
Healthy Cooking 2025
The landscape of healthy cooking is poised for significant transformation by 2025, driven by evolving consumer preferences, technological advancements, and a growing awareness of the link between diet and overall well-being. This shift will encompass changes in cooking practices, ingredient choices, and the very definition of "healthy."
Anticipated Trends in Healthy Cooking Practices
By 2025, we can expect a continued rise in mindful eating practices, with a greater emphasis on whole foods, plant-based diets, and personalized nutrition. Cooking methods will prioritize nutrient retention, with techniques like steaming, air frying, and sous vide gaining popularity over high-heat methods that can deplete vitamins and minerals. Meal prepping and batch cooking will remain prevalent, driven by the need for convenience and time efficiency.
Furthermore, a growing focus on reducing food waste will encourage creative recipes utilizing leftovers and minimizing ingredient spoilage. For example, the increasing popularity of apps and online resources dedicated to reducing food waste and creative recipe ideas will drive this trend.
The Impact of Technology on Healthy Cooking
Technology will play a pivotal role in shaping healthy cooking practices. Smart appliances, such as ovens with built-in sensors and automated cooking functions, will streamline the cooking process and ensure optimal nutrient retention. AI-powered nutrition analysis tools will help individuals track their macronutrient and micronutrient intake, personalize meal plans, and make informed food choices. Virtual and augmented reality applications could offer immersive cooking experiences, providing interactive tutorials and personalized guidance.
For instance, imagine an app that guides you through the process of preparing a complex recipe using augmented reality overlays on your kitchen counter, providing real-time feedback and instructions.
Popular Ingredients and Cuisines in Healthy Cooking
By 2025, the demand for functional foods and superfoods will continue to grow. Ingredients like spirulina, chia seeds, and various adaptogenic mushrooms will be increasingly incorporated into everyday meals. Plant-based proteins, such as lentils, tofu, and seitan, will become even more prominent as consumers seek sustainable and ethical food choices. Global cuisines known for their emphasis on fresh produce and whole grains, such as Mediterranean, Japanese, and Indian, will continue to inspire healthy cooking trends.
The growing interest in fermentation will lead to an increased consumption of fermented foods like kimchi, sauerkraut, and kombucha, recognized for their gut health benefits. For example, the increased availability of readily available, high-quality kimchi in mainstream supermarkets exemplifies this trend.
Challenges and Opportunities for the Healthy Cooking Industry
The healthy cooking industry will face several challenges in 2025. Balancing affordability and accessibility of healthy ingredients will be crucial, particularly for lower-income consumers. Addressing concerns about the sustainability and ethical sourcing of ingredients will also be paramount. Educating consumers about misinformation and promoting evidence-based dietary guidelines will be an ongoing task. However, opportunities abound.
The growing demand for personalized nutrition plans and customized meal kits presents a significant market opportunity. The development of innovative food technologies and sustainable farming practices will further contribute to the growth of the industry. The increasing interest in plant-based diets and sustainable food systems creates a fertile ground for innovation and expansion within the healthy cooking sector.
Conclusive Thoughts
Mastering Google Analytics is not merely about understanding website statistics; it's about transforming data into actionable strategies for growth. By consistently monitoring key metrics, optimizing content based on user behavior, and refining marketing campaigns, businesses can achieve a significant return on investment. This data-driven approach allows for continuous improvement and ensures your online presence effectively supports your business objectives.
Essential Questionnaire
What is the difference between sessions and users in Google Analytics?
A session represents a single visit to your website, while a user is a unique individual who interacts with your site. A single user can have multiple sessions.
How can I track conversions effectively in Google Analytics?
Set up conversion goals based on desired actions (e.g., form submissions, purchases). Google Analytics will then track these events and provide data on conversion rates and other relevant metrics.
What are some common mistakes businesses make when using Google Analytics?
Ignoring key metrics, failing to set up conversion tracking, not segmenting data properly, and not regularly reviewing reports are all common pitfalls.
How often should I analyze my Google Analytics data?
Regular analysis is crucial. Aim for at least a weekly review to monitor performance and identify trends, with more frequent checks for time-sensitive campaigns.